Gulf CSM Menu

The era of AI utilization in multi-store management is here. Gulf CSM AI Dashboard

Dashboard image Dashboard image Decoration

Dashboard Centralized management of KPIs and their changes related to people, goods, and money

Alert image Alert image Decoration

Alert Displays the number of alerts detected from forecast values and threshold checks

Suggest image Suggest image Decoration

Suggest Displays a list of data and matters to pay attention to, including risks

Attention image Attention image Decoration

Attention Analyzes sales, daily report comments, etc., and explains the overall situation of the company in writing

AI Dashboard image 1
AI Dashboard image 2
AI Dashboard image 3
AI Dashboard image 4

Utilizing AI is the key to
corporate growth!

In multi-store companies, understanding the situation of all stores, analyzing data, and addressing issues is essential for sound management. However, are you not facing a dilemma between that ideal and reality? From now on, it is the era of using AI for management and operations. Let's utilize data analysis, visualization of issues, and the development of improvement measures to contribute to corporate growth.

Image Image Image

For those involved in the management of multi-store companies,
are you facing such dilemmas?

Understanding the accurate situation of all stores is essential, but... Image

Understanding the accurate situation of all stores
is essential
, but...

To check the daily reports of all staff,
there is not enough time...

To check the daily reports of all staff, there is not enough time... Image

Is it good to have a meeting
only with managers and store managers?

Is it good to have a meeting only with managers and store managers? Image
I want to utilize the data obtained from daily store operations more effectively, but... Image

I want to utilize the data obtained from daily store operations more effectively, but...

Busy with daily operations,
I can't even analyze the data.

Busy with daily operations, I can't even analyze the data. Image

I don't know how to read the data. I can't analyze what the problem is from the numbers.

I don't know how to read the data. I can't analyze what the problem is from the numbers. Image

DecorationThe AI Dashboard will
solve such frustrations!
Decoration

Faster Image
Based on data Image
Easy to understand for everyone Image

What the AI Dashboard can do

01 Visualizing the situation Image
02 Summarizing topics Image
03 Discovering issues Image
04 Tracking causes from related data Image
05 Proposing improvement measures Image
01Visualizing the situation
02Summarizing topics
03Discovering issues
04Tracking causes from related data
05Proposing improvement measures

Clearly grasping
the situation
Clearly grasping the situation Image

Describing phenomena that are hard to notice in data

The AI analyzes the data and extracts what can be read from it, summarizing phenomena that are hard for humans to notice just by looking at the data, such as what is happening in the stores and what should be focused on in management.

Diagram <Decoding data>→Summarizing as topics→Looking at the sales of the top 10 menu items, there are peaks during the day (especially 11 am-2 pm) and in the evening and night (especially 6 pm-8 pm). Diagram <Decoding data>→Summarizing as topics→Looking at the sales of the top 10 menu items, there are peaks during the day (especially 11 am-2 pm) and in the evening and night (especially 6 pm-8 pm).

Early detection of
risks
Early detection of risks Image

Detecting anomalies from data related to people, goods, and money

The AI detects anomalies from data such as the number of employees, working hours, order quantities, waste amounts, sales amounts, and gross profit margins. It also predicts and points out areas where there may be risks of fraud, such as corrections to attendance information, cancellations of POS transactions, and cash discrepancies.

Diagram <Analyzing data>→Visualizing issues→The turnover rate of employees aged 45-49 is higher than that of other age groups. Diagram <Analyzing data>→Visualizing issues→The turnover rate of employees aged 45-49 is higher than that of other age groups.

Accurate
cause investigation
Accurate cause investigation ImageAccurate cause investigation Image

Presenting multiple data that are thought to be closely related to the issues

The AI presents multiple data as related materials that led to the detection of issues, such as anomalies and fraud risks. It provides clues for investigating the causes of problems, indicating what the factors are and where they are located from various angles.

Diagram <Correlation analysis of issues>→Presenting related data→Comparing average working hours and overtime hours by employee age group. Diagram <Correlation analysis of issues>→Presenting related data→Comparing average working hours and overtime hours by employee age group.

Rapid
action
Rapid action Image

Proposing directions and ideas for risk avoidance and business improvement

Based on each issue and the predicted causes, it proposes improvements such as reviewing campaigns and menus, and personnel allocation. Unlike human intuition, these proposals are based on data, providing a basis for decision-making in actions.

Diagram <Predicting based on data>→Suggesting improvement measures→Promoting improvement and equalization of vacation days, improving salaries and benefits. Diagram <Predicting based on data>→Suggesting improvement measures→Promoting improvement and equalization of vacation days, improving salaries and benefits.
Decoration

The AI Dashboard supports this entire series of tasks!

If you have the AI Dashboard,
you can enjoy these benefits!

Before

Image

There is too much data to look at and even if problems arise, they cannot be discovered.

Image

The effort of data aggregation and analysis is large
and there is not enough time for document preparation.

Image

Even if we hold a management meeting,
discussions stagnate due to lack of analysis and there is a sense of unfinished business.

Decoration

After

Easily grasping issues!

The AI automatically detects
the points to look at!

Easily grasping issues! The AI automatically detects the points to look at! Image

Efficient work!

Even large amounts of data
are quickly and accurately aggregated and analyzed by AI!

Efficient work! Even large amounts of data are quickly and accurately aggregated and analyzed by AI! Image

Next steps are clear!

Engaging in beneficial discussions based on data increases the accuracy of management decisions!

Next steps are clear! Engaging in beneficial discussions based on data increases the accuracy of management decisions! Image

By utilizing AI, the discovery of issues becomes speedy!
The measures to be taken become clear!

Contributing to solving the challenges of multi-store companies! Image Contributing to solving the challenges of multi-store companies! Image

Contributing to solving the challenges of multi-store companies!

Improving productivity

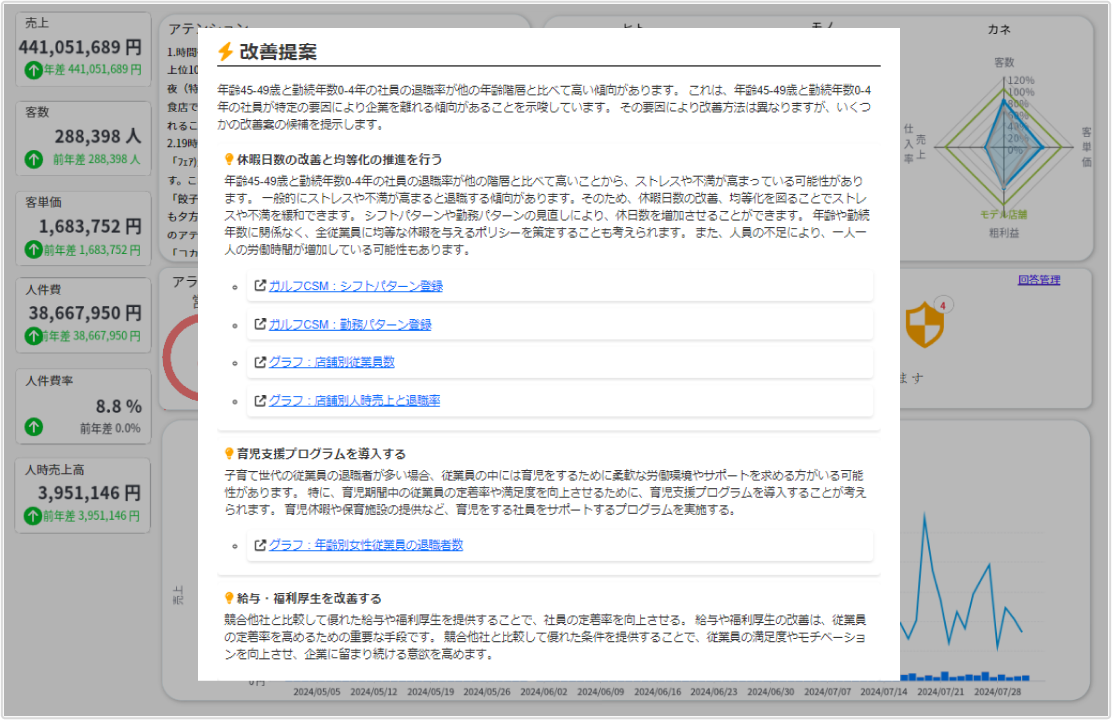
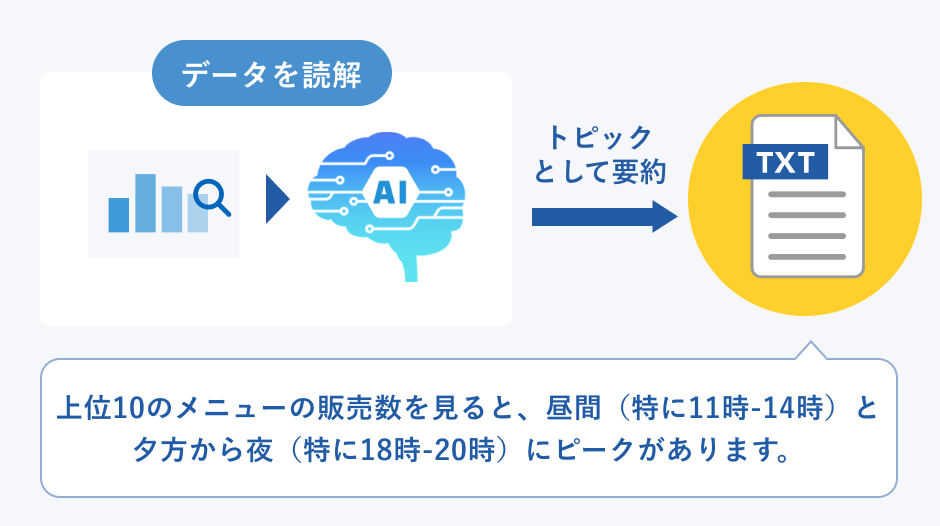
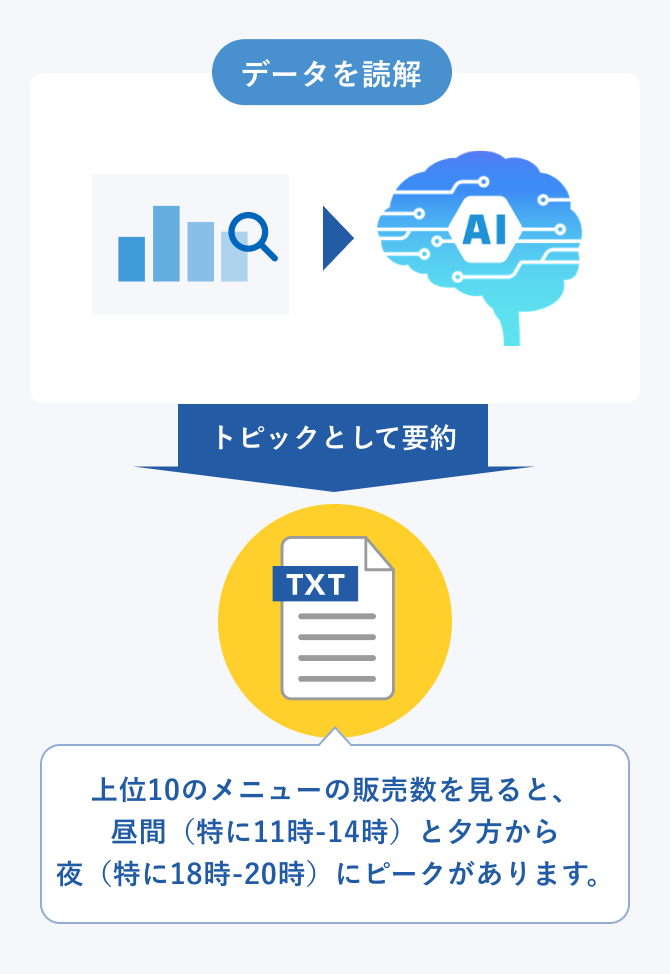
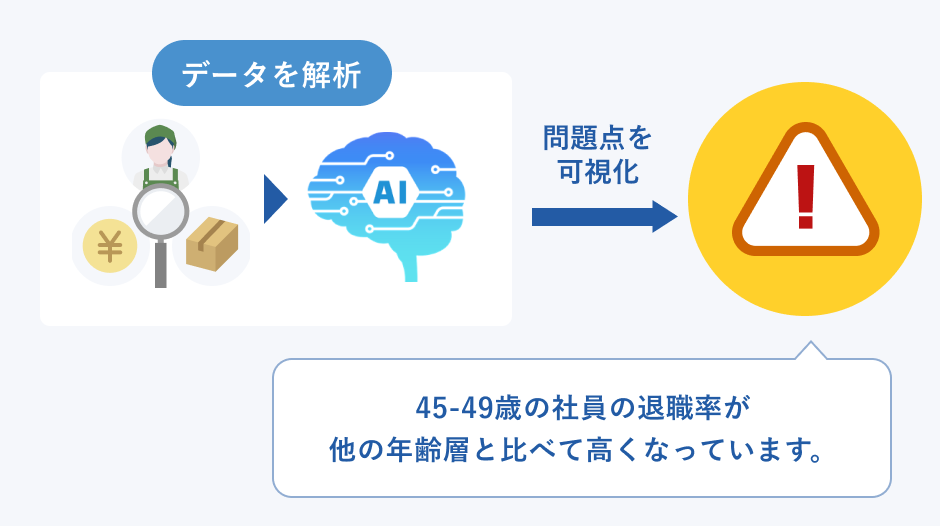
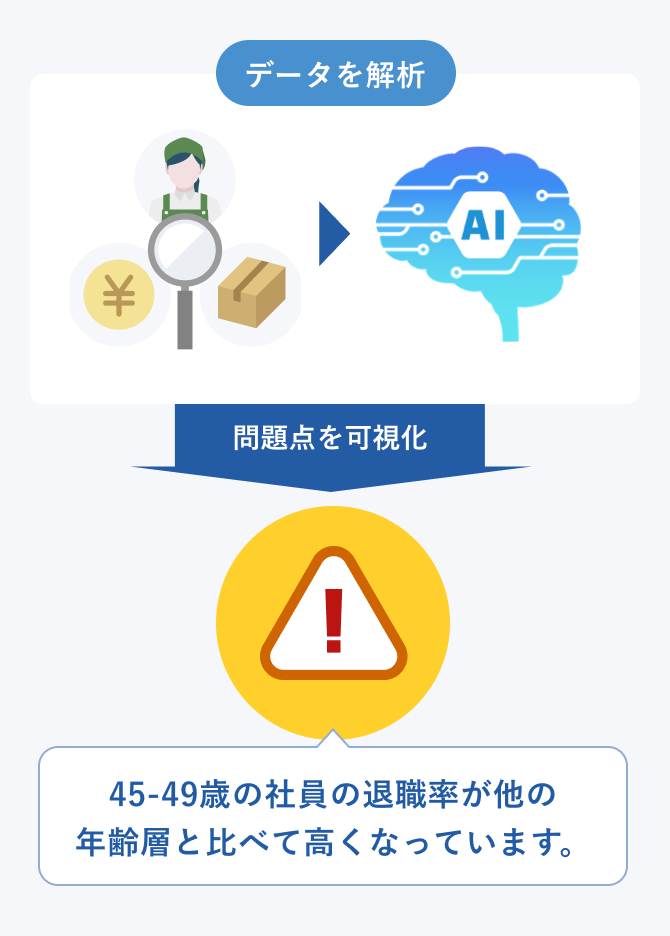
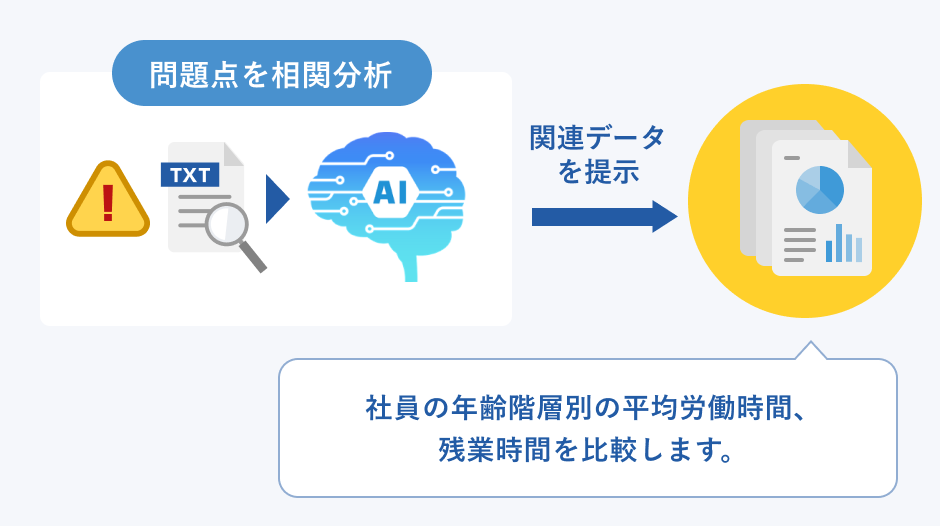
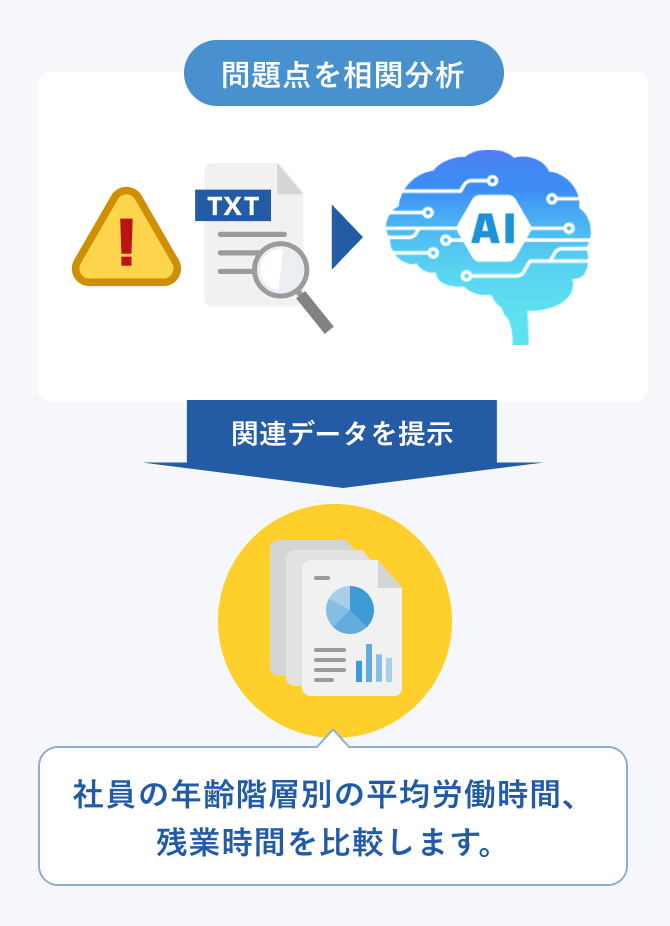
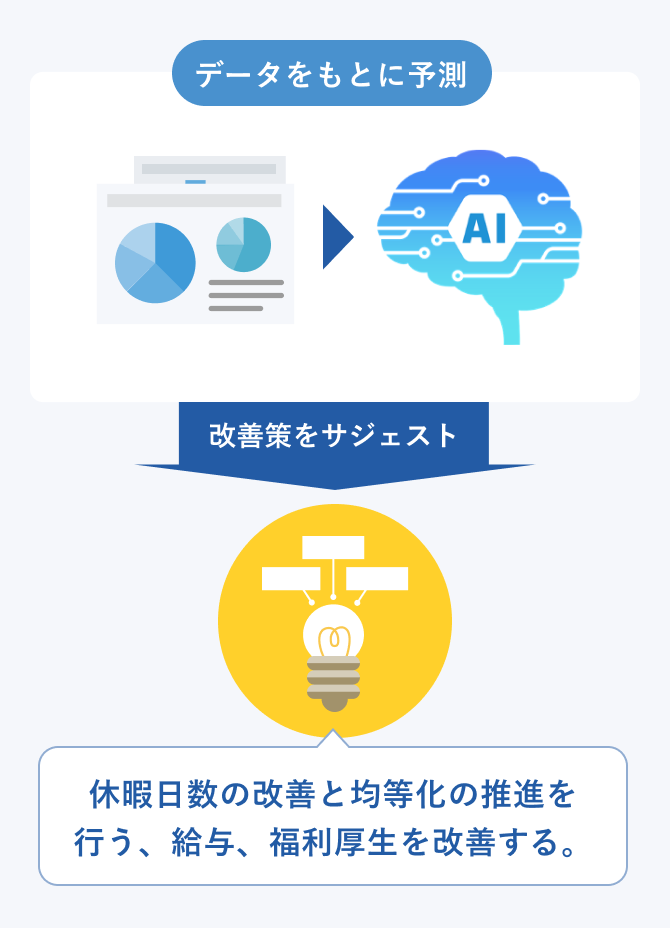
With many industries facing labor shortages, the number of store managers who manage multiple stores is increasing in multi-store companies. Even if they recognize the challenges, they are in a situation where they cannot allocate time for solutions. The support of the AI-driven problem-solving process greatly helps with this issue and leads to increased productivity.

Reducing labor cost ratio

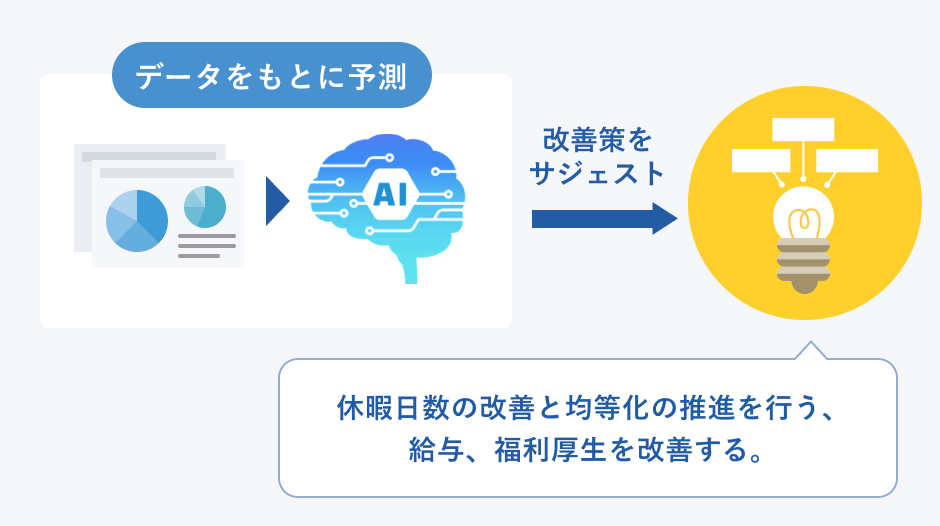
If productivity improves through the use of AI, the amount spent on wages, which are soaring due to labor shortages, can be reduced, leading to a decrease in the labor cost ratio.

AI Dashboard

Visualizing management issues, analyzing, and devising improvement measures more quickly and smartly with AI!

Contact us here
AI Dashboard image
Download materials image

You can tackle problem-solving
regardless of personal experience or
skills!Download materials

We provide a detailed introduction of how the suggestion function of the AI Dashboard can be helpful, along with actual screen display examples.

Download materials

Other AI Solutions from GulfNet